Why are U.S. Bonds Weak?

I asked if the bond rally could continue in a March 11, 2025, Barchart article where I concluded:
The five-year charts illustrate that the bonds and TLT ETF have been in sideways trading ranges since the October 2023 low. Bullish and bearish factors are pulling government debt in opposite directions. While the short-term trend is positive, it will take a move above 127-22 in the bonds and $101.64 in the TLT to reverse the bearish paths of least resistance that have gripped the long-term debt markets over the past five years.
On March 10, 2025, the long bond futures for June delivery were trading at 117-25, with the TLT ETF at the $91.30 per share level. The bonds and TLT have moved lower over the past month.
Long bond futures fall
While the U.S. dollar index has declined below the 100 level, which tends to cause U.S. interest rates to fall, and the stock market has corrected, the U.S. 30-year Treasury bond futures have defied historical trading patterns, as they have declined instead of rallying in the current environment.
Stocks and the dollar fell on April 7, pushing the long bond futures to the most recent 122-05 high on the nearby June futures contract.

The daily chart highlights the recent bearish trend that has taken the June long bond futures to a 111-17 low on April 9. At the 115-26 level in late April, the bonds remain closer to the recent low than the April 7 high as interest rates remain elevated.
TLT declines
Since April 7, the highly liquid iShares 20+ Year Treasury Bond ETF product (TLT) has moved lower with the long bond futures.

The daily chart illustrates TLT’s 9.66% decline from $94.09 to $85 per share. At the $88.86 level, TLT remains below the midpoint of the most recent trading range and in a bearish trend. However, since the most recent lows, TLT and the long bond futures have made higher lows and higher highs.
Tariffs are distorting markets
Tariffs create trade barriers, which distort asset prices. Given the level of the tariffs, the Trump administration’s trade initiative to level the playing field stunned markets.
Time will tell if President Trump designed the tariffs to shock the global financial system as a negotiating tactic. However, the initial reaction across all asset classes was significant, with stocks, bonds, and currencies falling, while the inflationary impact sent some commodity prices higher. Gold’s price soared to record highs at over $3,500 per ounce, in a warning sign for markets. Gold is the world’s oldest means of exchange, flashing a warning sign in the global financial system.
The U.S. is the world’s leading consumer country, and U.S. tariffs are an economic weapon. Meanwhile, the 2020 global pandemic’s legacy and the bifurcation of the world’s nuclear powers since 2022 have been watershed events. Markets reflect the economic and geopolitical landscapes, which have been highly turbulent over the past five years. The U.S. tariffs are the latest destabilizing event causing market volatility.
The U.S. government bond market is less of a haven for safety for three reasons
Currency and government bond markets derive value from the full faith and credit of the countries issuing legal tender and government debt securities. Gold is a global asset, and its value transcends borders. The U.S. government bond market has remained under pressure with interest rates elevated for three reasons:
- The U.S. government’s debt of over $36.7 trillion is growing, undermining faith and credit in the United States.
- The bifurcation of the world’s nuclear powers has caused increased military spending and increased potential conflicts.
- Strained U.S. relations with traditional allies have altered trade and other post-WWII relationships.
The United States depends on foreign buyers for debt securities. While still the economic leader, its position has declined over the past years, leading it to pay higher interest rates to service its high debt level.
Levels to watch- The bonds and TLL remain within the trading range
While long-term U.S. interest rates remain elevated, the short-term Fed Funds Rate has dropped 1% from its high. The Fed had forecast two more rate cuts in 2025 for a total of 50 basis points. While the latest inflation data has shown the economic condition moving towards the central bank’s 2% target, Fed officials have said that the uncertainty and level of the administration’s tariffs could cause inflation to rise, indicating that their enthusiasm for rate cuts has declined and the current 2025 pause will continue.
Meanwhile, the longer-term rates have remained within the range since October 2022.
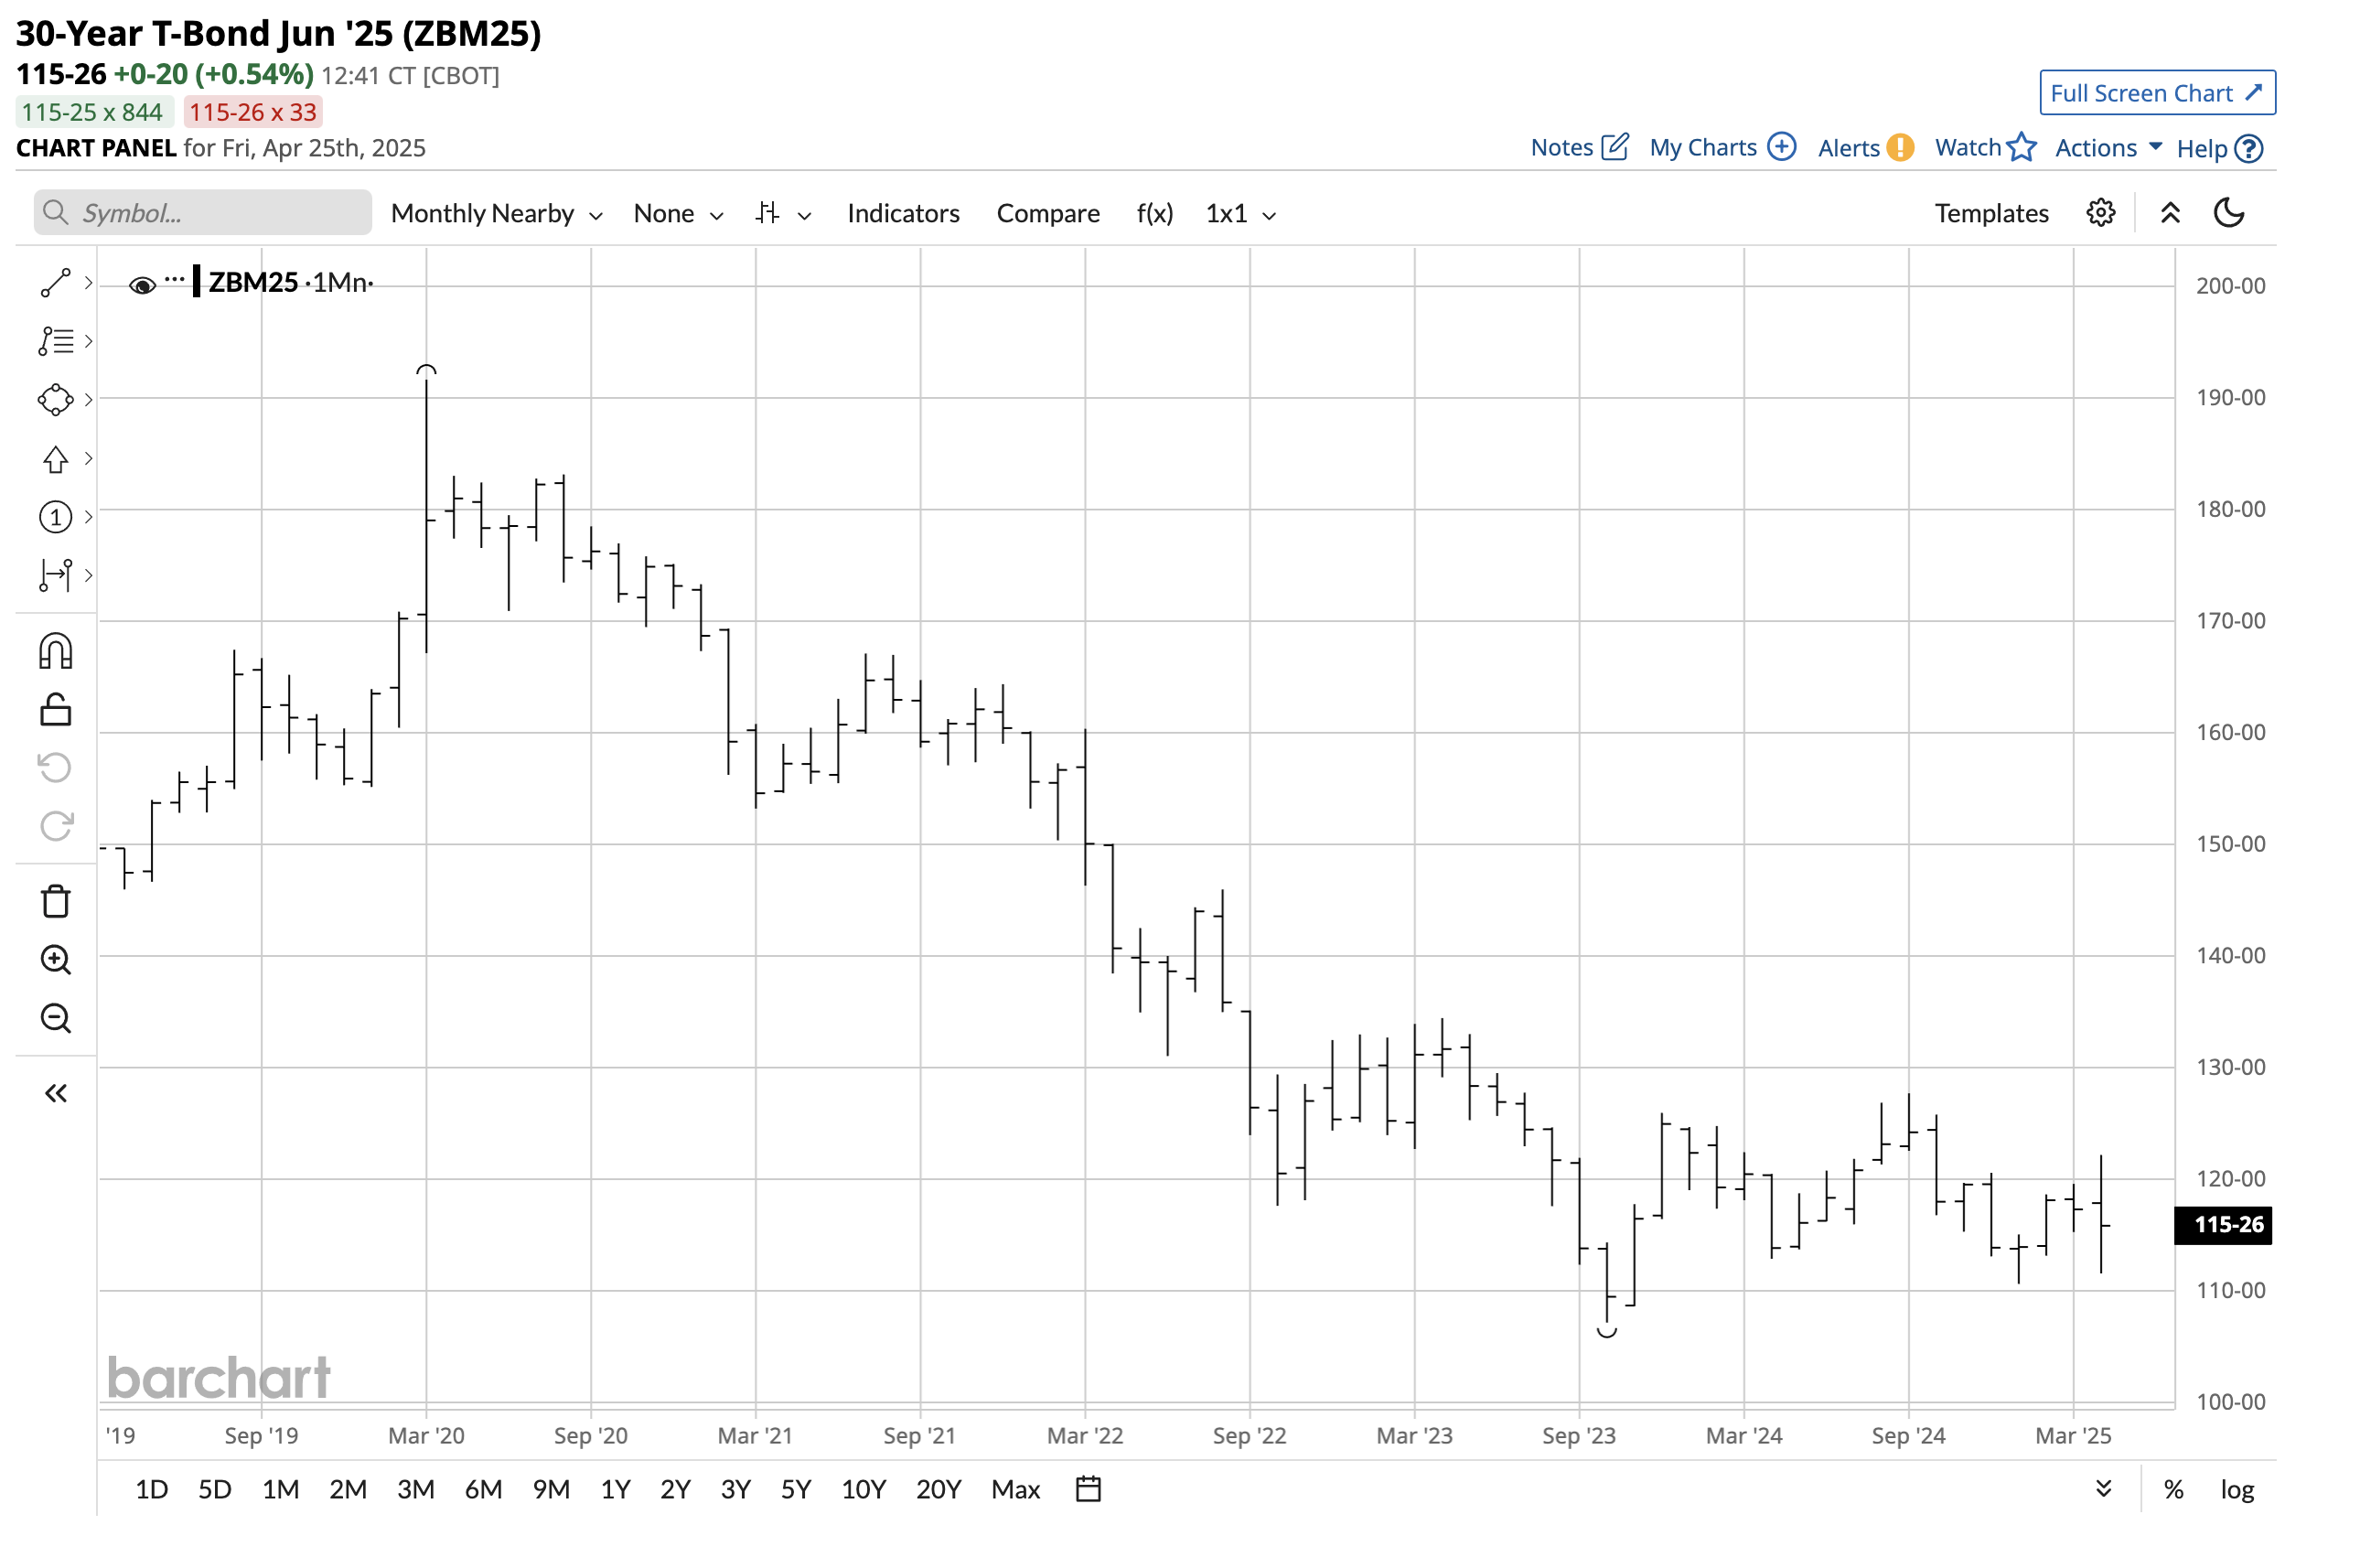
The monthly continuous long bond futures chart shows it has traded in a 107-04 to 134-14 range since October 2022. At the 115-26 level in late April, the bonds are closer to the lows as rates remain elevated.
Trade deals between the U.S. and its leading partners worldwide, including China, Japan, the EU, Canada, Mexico, and others, could lift bonds as they would reduce inflationary pressures and fears. Meanwhile, a long-term standoff could send the long bonds lower and interest rates higher. The 107-04 support and 134-14 resistance are the critical technical levels in late April 2025.
On the date of publication, Andrew Hecht did not have (either directly or indirectly) positions in any of the securities mentioned in this article. All information and data in this article is solely for informational purposes. For more information please view the Barchart Disclosure Policy here.